[Infographic] The Alarming Rate of Data Breaches
Posted on 18 February 2014 by
Based on the Breach Level Index, this infographic shows the rate at which data records were lost or stolen in 2013 and the source of the breaches.
Posted on 18 February 2014 by
Based on the Breach Level Index, this infographic shows the rate at which data records were lost or stolen in 2013 and the source of the breaches.
Posted on 18 March 2014 by
In our six-part series, ‘Securing the Breach’, we will take you on a journey – starting with the current state of data security and how we got here.
Posted on 29 April 2014 by
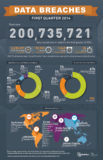
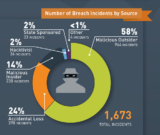
After collecting publicly available information about worldwide data breaches, the Breach Level Index (BLI) showed that there were over 200 million data records lost or stolen in the first three months of 2014. As our new infographic shows, that means there were over 2 million records lost or stolen every day. That’s 26 records a […]
Posted on 03 March 2016 by
Learn what 2015 data breach statistics reveal about retail, government, and other industries as well as the leading types and sources of breaches.
Posted on 18 November 2014 by
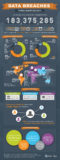
After collecting publicly available information about worldwide data breaches, the Breach Level Index (BLI) showed that there were over 183 million data records lost or stolen from July through September 2014. As our new infographic shows, that means there were nearly 2 million records lost or stolen every day. That’s 23 records a second. Of the […]
Posted on 20 January 2015 by
Pairing companies and simulating a Vegas-type point spread provides a great model for highlighting the winners vs. losers when it comes to securing data.